While retailers have been rushing around organising marketing campaigns for Black Friday and Christmas, the travel industry has been biding its time, plotting for its own peak sales season. January has traditionally been a vital time in the travel calendar when all travel merchants are doing everything they can to get their brand to the front of consumers’ minds. It’s the time when priorities shift from panicking about Christmas shopping to planning for the summer holidays.
In order to make the most of this peak period, travel companies need to fully utilise their historical data to ensure the best possible marketing decisions are made. At affilinet, we’ve reviewed data between Christmas Eve and the 28th February from the last two years in order to make sure that all campaign planning and recommendations are steered by the data we have at our disposal.
When does peak start?
The first thing for travel companies to consider is the timing of their peak offering launch. Brands need to understand which days and/or weeks over the peak period are likely to see the highest level of consumer traffic to the travel sector.
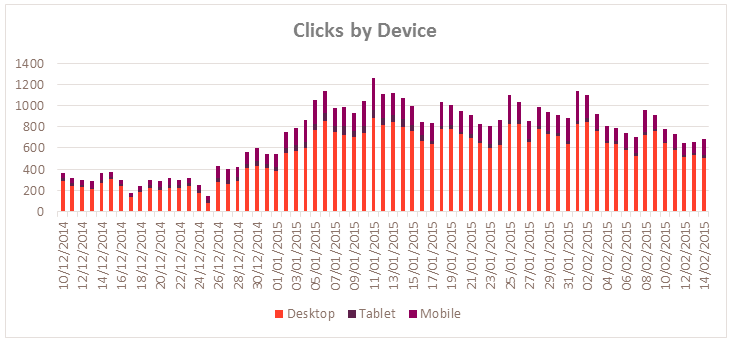
Data across 2014 and 2015 shows that Boxing Day clicks surpass the total click numbers for the five days prior combined; increasing 449% day on day from Christmas Day. This suggests that the 26th December is exactly the right time to launch a peak campaign.
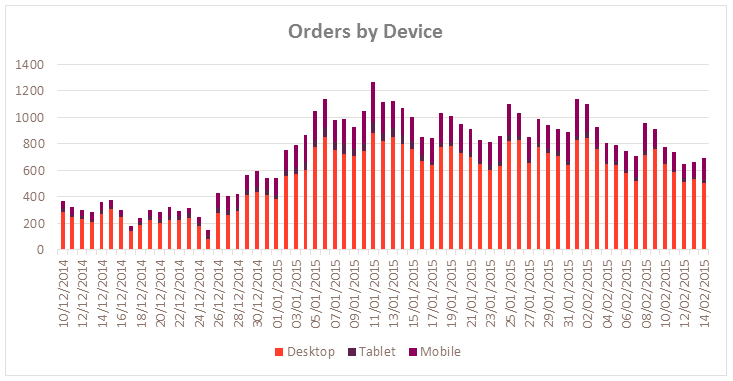
However, travel companies should be cautious about making decisions on just click data alone, as sometimes the order statistics can tell a completely different story. The data shows that whilst consumers begin browsing heavily from Boxing Day, the uptake in orders shows less of a sudden increase and more of a slow progression. On the 5th January there were 320.5% more sales than on Christmas Eve, but this increase was on a far flatter curve.
Which device do consumers prefer to shop on?
Consumers are becoming more omni-channel and the travel industry is no exception in its need to respond. A consumer wants to be able to search through their travel options across multiple devices seamlessly, so brands need to provide a service that matches that demand. Data from the 2014/15 peak season shows 23.4% of orders coming via tablets, with mobile picking up 4.2%. While this data is significant, it doesn’t tell the whole story.
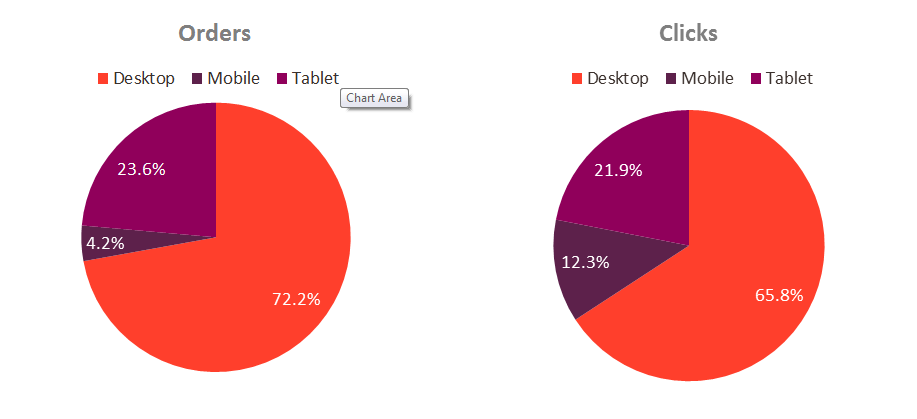
From the analysis of click data, we can see that mobile is actually far more significant than the order reports suggest. Despite converting just 4.2% of orders, mobile saw 12.3% of clicks in the travel sector which demonstrates the platforms vital role in the research process for consumers. If a travel merchant were to place limited emphasis on providing a positive mobile journey, then this could impact on a consumer’s ultimate decision to purchase with that brand.
What is clear through the data though is that consumers feel more than comfortable ordering, as well as browsing, through tablets (both clicks are orders over 20%) over mobile. One reason for this is that consumers tend to shop on mobile while on the move; either walking somewhere or travelling on public transport. Neither of these scenarios lends itself to making a purchase with a high order value. Tablets however are items typically used in the home, where decisions involving higher levels of expenditure are more easily made.
When are people booking their holidays for?
Once a brand knows when they should start targeting consumers, they need to understand what their customers are looking for. During the 2013/14 peak travel season, affilinet’s data shows that consumers were booking holidays at an average of 126 days in advance. This then increased the following year to 133 days, suggesting that consumers may be looking to plan even further in advance this year.
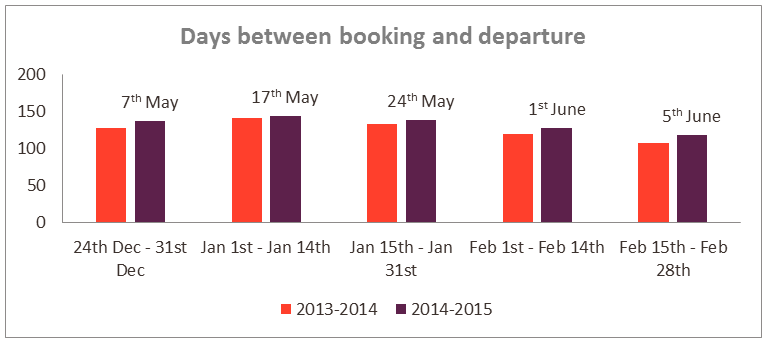
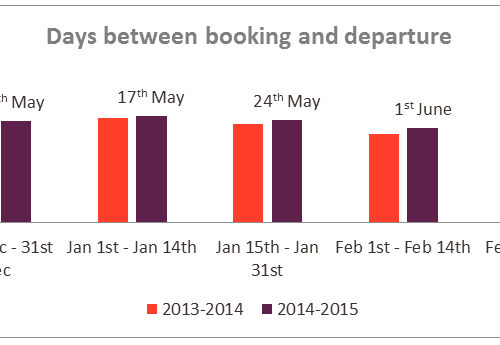
Beyond that, there is a clear correlation between the booking and departure date gap, and what date the holiday is booked. The week from Christmas Eve to the end of December showed that consumers were booking travel for around the 7th May, but the first two weeks of January saw that average date shift back a few weeks. This analysis should help brands better understand what departure times they should push in their marketing activities and at what time. Looking at data later in window, the average departure date stays fairly consistent, with departure date shifting only two weeks over an 8 week booking period, demonstrating the correlation between booking date, and the booking and departure date gap. One interesting thing of note is that the data shows the average booking time falling between May to mid-June, which goes against the common conception that August – the traditional summer holiday peak – is the departure time that consumers are most looking to book for in January.
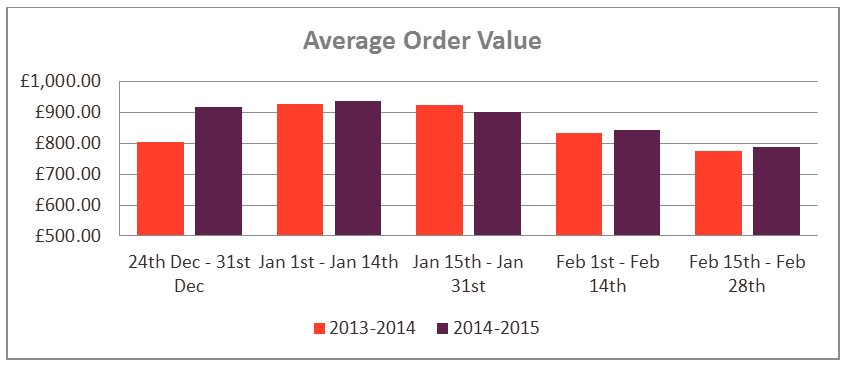
Order value is also an important metric to analyse. As the data shows, average order value falls from a peak of £938 at the start of January, to just £787 at the end of February. For travel companies to successfully secure orders during this period, the order value of the product being pushed should be considered to ensure that sales opportunities are being maximised.
Beyond direct competition, travel brands working towards the 2015/16 peak season face tough trading conditions, given the current geopolitical climate. By utilising and analysing the data that is available merchants, as well as travel publishers, will be able to maximise their performance throughout this vital period, protecting profit margins as best they can in what are at best, uncertain times.