
How much time do you spend online in a day? 1 hour, maybe 2?
The average time spent online on the world wide web has certainly gone skywards over the last 2 years.
Many companies now get told that you can’t be a success unless you’re online, and it really is true. Mobile marketing and social media marketing have taken up a huge chunk of the online world, it’s the best way to get to your customers without having to heavily spam them with emails.
And although email marketing is still alive and well, many much prefer the simplicity of Tweeting someone or liking a page.
A good indication of how much time is spend online, and on what, can be seen when looking at what happens in an internet minute. Many of you may have seen the infographic made by Qmee “Online in 60 seconds” which reached the surface in 2013, showing us what we all did over the year.
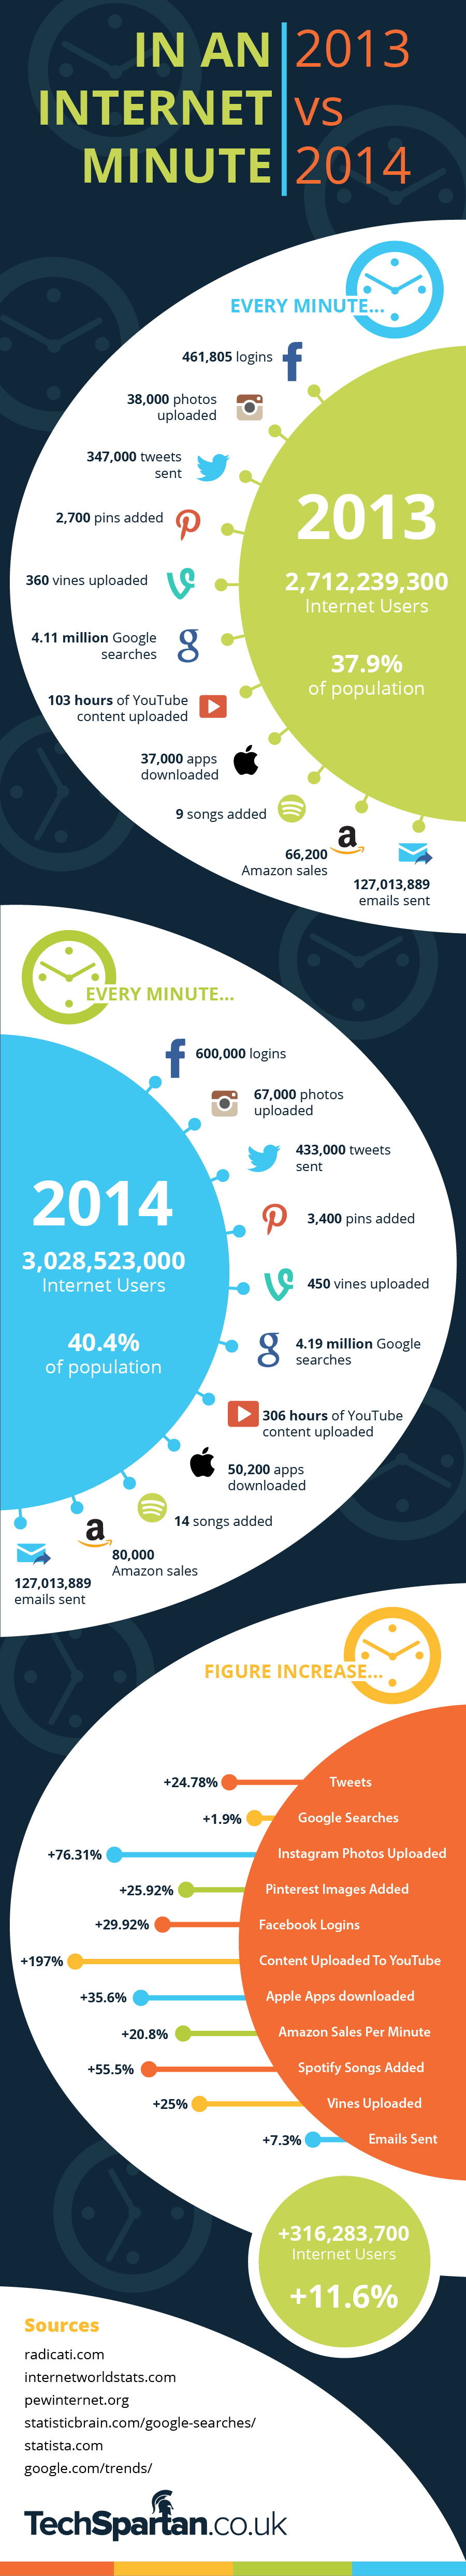
But there is a new infographic (seen below) from the technology enthusiasts at Tech Spartan, who have made an image showing internet usage over 2013 and 2014 and have also made a table showing the percentage increase for all areas. The figures are actually quite surprising when they are turned into a growth percentage.
You may think that due to the huge surge in internet users between 2013 and 2014 (increasing by 11.6%) that the amount of Google searches would have also in turn increased dramatically. Amazingly, Google searches only increased by 1.9 percent from 2013 to 2014.
The largest increase of growth listed in the graphic is actually content uploaded to YouTube, which grew by a staggering 197% within a year. This is followed by the second most popular activity listed, Instagram photos upload which grew by 76.31%. Read on to find out more surprising facts and figures..
Infographic Source: http://www.techspartan.co.uk/features/internet-minute-2013-vs-2014-infographic/